The iTEM database is a collection of outputs from the iTEM participants. The full database is currently not made public.
This page briefly outlines the content of the database. The capitalized words MAY, MUST, SHOULD, etc. have the meanings described here; groups submitting data to iTEM MUST understand and follow these guidelines. Contact the organizing team with any questions.
Quantities
Download an example data reporting template: CSV — OpenDocument — Microsoft Excel.
Data are collected in series of annual data points between a start year and end year. Series SHOULD include every fifth (2025) or tenth (2030) year; other intermediate years MAY be included.
Each data series is labelled along the following conceptual and physical dimensions. The labels for each dimension are text strings. Commas in the labels SHOULD be avoided; where this is not possible, the fields MUST be quoted when the data is provided in CSV format.
1. Model
The model that produced the data series.
2. Scenario
Each modeling group's internal name for a distinct set of assumptions or policies. Scenarios are loosely grouped as "Reference" and "Policy".
- Participants MAY submit one or more "Policy" scenarios, but MUST submit at least one "Reference" scenario.
- Participants MUST submit, separately from the data files, a description of each scenario included. This description MAY take the form of a reference to existing publications.
3. Region
Particular region of the world (group of countries, country, or subnational division) described by a series, or the value Global. See Regional downscaling, below.
4. Variable
The conceptual quantity described by the series.
- Data submissions MUST include a field
Unitdescribing the units for the data. - Participants SHOULD submit data in the suggested units; where this is not possible, they MUST supply an unambiguous description of the units used.
5. Mode
The mode or modes of transport described by the series, or the value All.
6. Technology
The energy technology described by the series, or the value All.
Each Mode may be disaggregated to one or more Technology. For instance, the light duty vehicles (LDV) mode may be powered by an internal combustion engine (Liquids) or a plug-in hybrid-electric (PHEV) powertrain technology.
7. Fuel
The energy source or carrier described by the series, or the value All.
Each Technology may employ one or more Fuel. For instance, LDVs with PHEV powertrain technology may use both gasoline, diesel or biofuels (Liquids) or Electricity.
Submission & analysis software
Submitting data in a common format facilitates automated comparison by the analysis software co-developed by the iTEM organizing team.
iTEM data can be voluminous; for iTEM2, some participants submitted over 10,000 series. Participants are strongly encouraged to script or otherwise automate the conversion of data from their models' native output formats to the format described here. This has two benefits:
- Unlike a manual process, the code can easily be checked for errors, and its outputs replicated.
- Data may be revised with little effort as model development progresses and projections change.
Regional downscaling
The global transportation models in this study sub-divide the world into between 7 and 32 regions, where a model region is composed of one or more countries. As these models were developed by different institutions with different purposes, the regional boundaries used differ significantly between models. In order to conduct analysis at the region level, with common regional definitions, in this study we first "downscale" each model's output for all quantity variables (i.e., annual flows) to the country level, and then re-aggregate to the 16 study regions. Derived variables such as intensities are then computed from the aggregated quantity variables.
The key to the downscaling method used here is the selection of an appropriate downscaling proxy, defined as the variable used to apportion multi-country regional quantities down to the country level. The key criteria for a downscaling proxy are as follows:
- the information needs to be available at the country level, and
- the data needs to be a reasonable approximation of the particular variable being downscaled.
The following are the key datasets and methods used for downscaling:
- SSP Socioeconomics database: The Shared Socioeconomic Pathways database's population and GDP-PPP projections for the SSP2, or "Middle of the Road", scenario were used for the downscaling of population and GDP from model regions to countries. These projections cover all reporting years from 2000 to 2100, for about 180 countries.
- CDIAC: Fossil-Fuel CO2 Emissions by Nation: The CDIAC CO2 emissions by nation are used to downscale reported CO2 emissions by all sectors (for models with whole-economy coverage), in the years 2005-2010. For 2015-2100, the country-level 2010 CO2 emissions quantities are multiplied by the PPP-GDP ratio from 2010 to each year, so that region-level emissions are apportioned increasingly to countries that account for increasing shares of the region's economy. Similar methods are used for transportation energy, and are documented below with examples.
-
IEA Energy Balances: The IEA Energy Balances present estimates of energy consumption by fuel for eight transportation modes, two of which are not used (pipeline transport and non-specified), and the two aviation categories (domestic aviation and international aviation) are added together and named "AIR" in the table below. For downscaling we use the energy consumption by all fuels (total). The mapping from iTEM2 transportation modes to the IEA's categories (flows) are shown below.
Mode FLOW 2W and 3W ROAD Aviation AIR Bus ROAD Domestic Shipping DOMESNAV Freight Rail RAIL Freight Rail and Air and Ship RAIL HDT ROAD International Shipping MARBUNK LDV ROAD Passenger Rail RAIL Road ROAD Rail RAIL
For each reported iTEM2 annual flow by model region (e.g., energy consumption or emissions, but not intensities or emissions factors), the country-within-model-region share is computed directly from the IEA's data for the period from 2005-2010. For subsequent years, these shares are calculated from the IEA's 2010 energy consumption quantities multiplied by each country's GDP-PPP ratio (SSP2 scenario) from 2010 to 2100.
One of the key features of the downscaling method is that the country-within-model-region shares evolve over time according to the GDP pathways assumed in SSP2. Thus, the quantities of energy assigned to the countries reflects that some countries may follow a different development trajectory than their parent region. While South Africa is not an iTEM model region, it nevertheless illustrates the issue well: in 2010, it accounts for 20% of the GDP of Africa, and in 2100 in the SSP2 scenario it accounts for 2%. The following figure shows the evolution of Brazil, Mexico, and Other Latin America as a share of the total reported quantities for the Latin America (LAM) region in the MESSAGE model for the Reference scenario.
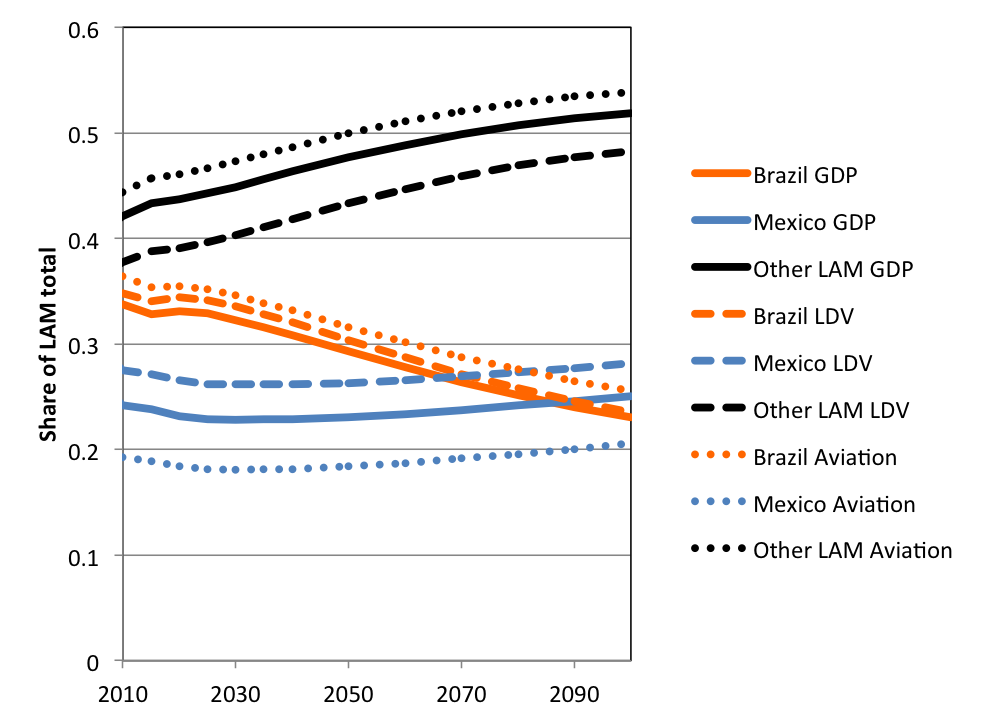
As shown, the GDP shares (solid lines) of Brazil and Mexico are 34% and 24% in 2010, respectively, and decline to 23% and 25% by 2100 in the SSP2 scenario. The shares of energy consumption, passenger kilometers travelled, and all other transportation-related quantity variables also follow the GDP trends in going from 2010 to 2100. In this way, Brazil and Mexico data are downscaled from data reported for Latin America as a whole, in a way that is consistent with the sub-regional dynamics of the SSP2 scenario.
Coverage
The following table gives the number of (Scenario, Region, Mode, Technology, Fuel) combinations for each Variable in the iTEM 2 data base, and thus a general sense of which variables are reported by which models.
For all models except ITF, variables with _percapita in the name are derived from the corresponding absolute value and the population for the corresponding region.
{% csv {static}/file/coverage.csv %}